
The dashboard gives you an overview of your sales performance and tourism activity. Access: Dashboard menu (first item in the navigation).
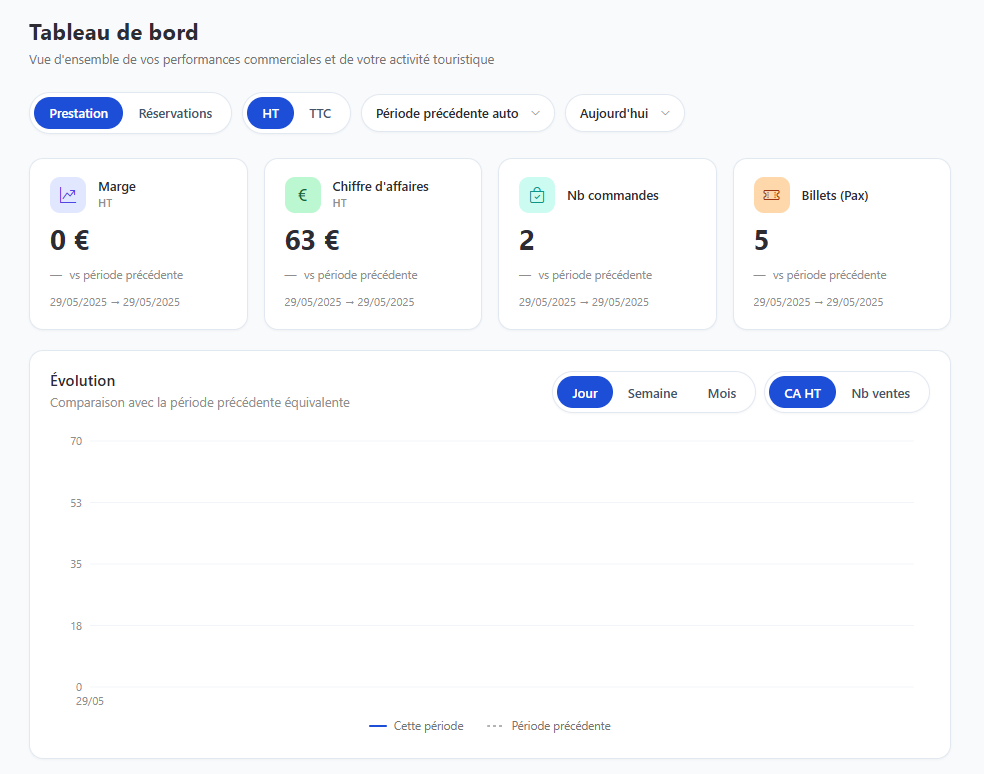
Page structure
The page has 4 areas: the filter bar, the key indicators (KPIs), the trend chart, and the Top products rankings.
1. The filter bar (top)
These filters apply to the whole dashboard at once.
| Filter | Options | Purpose |
|---|---|---|
| Service / Bookings | 2 modes | Chooses the analysis logic: by service date (activity date) or by booking date (purchase date). |
| Excl./Incl. tax | 2 modes | Shows amounts before tax or with all taxes included. |
| Previous period | Auto or Custom | Sets the comparison period. Auto = equivalent previous period calculated automatically; Custom = two chosen dates. Feeds the “vs previous period” figures. |
| Analysis period | Custom + shortcuts | Sets the main period being studied. |
Available period shortcuts
- Custom period: enter a start and end date, then Apply.
- Quick periods: Today · Last 7 days · Last 14 days · Last 30 days · Last 90 days · This month · Current year · Last 12 months.
2. Key indicators (KPIs)
Four cards summarize performance over the selected period. Each shows the value, the change vs the previous period, and the relevant date range.
| KPI | Meaning |
|---|---|
| Margin (excl./incl. tax) | Margin generated over the period. |
| Revenue (excl./incl. tax) | Total revenue generated. |
| No. of orders | Number of orders recorded. |
| Tickets (Pax) | Number of tickets/participants sold. |
The excl./incl. tax toggle directly changes how Margin and Revenue are displayed.
3. The “Trend” chart
Compares the selected period with the equivalent previous period.
- Granularity: Day · Week · Month (time axis).
- Metric shown: Revenue (excl. tax) or No. of sales.
- Legend: solid line = This period · dashed line = Previous period.
- Useful for spotting trends and differences from one period to the next.
4. The “Top products” rankings
Four tables rank your products by different criteria (each row shows the product, its supplier, and the value).
| Block | Ranks products by… |
|---|---|
| Top products — Number of orders | Number of orders per product. |
| Top products — Number of tickets sold | Quantity of tickets/pax sold. |
| Top products — Margin | Margin generated per product. |
| Top products — Revenue (detail) | Detailed revenue per product. |
Best practices
- Start by setting the analysis period and the Service/Bookings mode before reading the figures: everything else follows from it.
- Keep excl. tax mode to manage profitability, incl. tax for the “cash register” feel.
- Cross-check the 4 Top products blocks: a product strong on tickets but weak on margin isn’t worth the same as a profitable product.
- Use the previous period comparison to measure real growth rather than a raw number.